Research
- An infographic is a means by which one can communicate information visuallyWhat makes an infographic?
- Quick clear information
- Things that would require too much word explain are told visually
- Be concise first, add broadening infromation later
What are infographics used for?
- Maps are considered some of the first "infographics"
- other current common versions of infrographics are things such as graphs and time lines
- Infographics are commonly used for education, in the news, and by activist and other non profit organizations to disseminate knowledge effectively
Inspiration
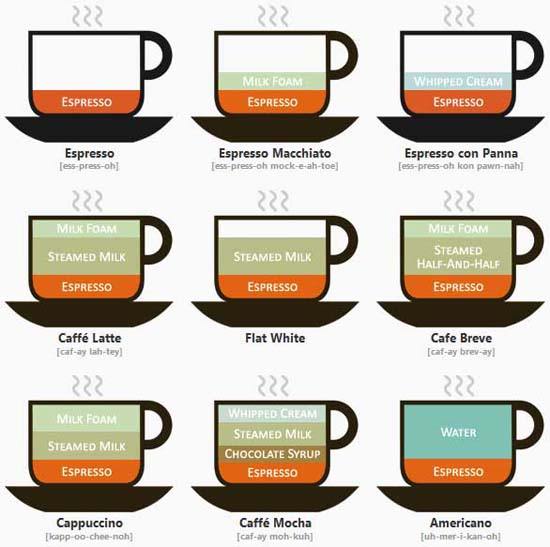 I particularly like when infographics incorporate the thing that they are explaining as the information like this. I also like how simple it is
 I like this timeline because it feels very dynamic. It has great rythym and feels like its coming atchya
No comments:
Post a Comment